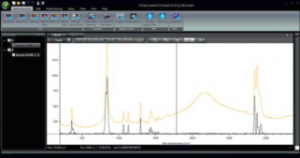
Micro-region in situ optical multi-characterization system
Model:MonoVista CRS3+
NEW! Spectral imaging system that integrates Raman, fluorescence lifetime, and Brillouin scattering test functions!

The new generation of monovista CRS3+ is an innovative “optical comprehensive test station” and a highly expansive scientific tool。
- Scientific Raman Spectrum & Mapping;
- TCSPC Lifetime Mapping
- Brillouin Scattering Spectrum
- S&IThe company excels at providing a variety of customized solutions
MonoVista CRS3+peculiarity :
- Deep ultraviolet to near-infrared wavelength range
- Up to 5 fixed wavelength lasers are built-in
- Optionally with an external large laser port
- Dual UV and visible/near-infrared beam paths
- Automatic control of laser selection
- Auto alignment, focusing and calibration functions
- Automatic wavelength and intensity correction function
- Ultra-high Raman spectral resolution, (0.9cm-1)
- Low-wave Raman can be tested to +/- 10 cm-1
- High wave number range up to 9000cm-1 (@ 532nm)
- Stepper motor and piezo drive XYZ displacement table
- Fast Raman mapping
- Integrated control heating/cooling station, liquid helium temperature cryogenic thermostat
- Can be combined with Raman imaging and atomic force microscopy imaging
- Automatic control of the polarization spectrum function
- Extended to use with atomic force microscopy (AFM);
- Integrated Brillouin scattering spectrometer;
- Integrated TCSPC fluorescence lifetime imaging with 4ps temporal resolution
- Upright/inverted/dual microscope
- Thermoelectric refrigeration and liquid nitrogen refrigeration detectors
- Flexible configuration of imaging spectrometer with dual entry and dual output
- Compatible with picosecond white lasers
- Expand different configurations according to the user’s application needs, in the case of ensuring automatic control and high reliability of the system,
- A variety of optical characterization methods for materials are available:
- Raman microscience spectroscopy + fluorescence lifetime TCSPC imaging + Brillouin scattering test
- Variable temperature infrared spectroscopy / time-resolved spectroscopy / darkfield spectroscopy / micro-absorption spectra
- Especially suitable for high-pressure scientific research, large sample system, low temperature,
- strong magnetic, high temperature and other test environments
I.Research-grade Raman spectroscopy and imaging
- S&I’s Monovista CRS+ Raman microscope system is based on OLMPUS upright and inverted confocal Raman microscopes,
- Provides spatial resolution at the micron scale, using ESAY Confocal technology, to obtain the maximum amount of signal flux
- Software-driven XYZ displacement table supports automatic 3D Raman mapping.
- German original automatic systems offer new unrivalled reliability, flexibility and ease of operation.
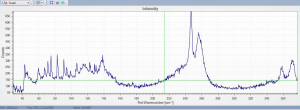
- Ultra-high system sensitivity, under recognized test conditions, monocrystalline silicon third-order Raman spectroscopy signal-to-noise ratio of up to 30:1
 |
 |
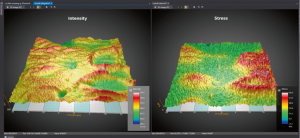
2D Raman mapping function @ silicon substrate stress analysis |

Fast Raman Mapping |
DAC Sample Raman on WSe2 @ 532nm Laser @2400 g/mm Grating @ Center Wave 206 cm-1 @ 60s Exposure Time
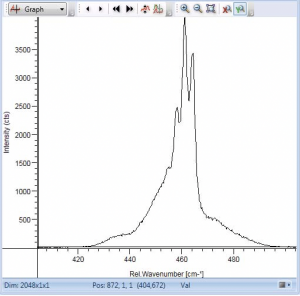
CCL4Ultra-high Raman resolution 0.7cm-1 |
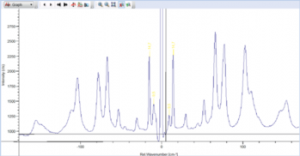
低波数性能:+/-10cm-1 Stokes/Anti-Stokes spectrum from |
Provide 488,532,633,785 nm and other laser wavelength low-wavelength Raman spectral test capabilities (> =+/-10cm-1) Monovista CRS3+ system with the highest spectral resolution of 0.7cm-1;
II Fluorescence lifetime test (TCSPC imaging)
- Upright/inverted time-resolved confocal fluorescence microscopy
- Complete microscope with laser coupling module
- Laser wavelengths range from 375 nm to 810 nm
- TCSPC counting module: time resolution 4ps,
- Test life time 0 ~ 33us
- Number of time channels: 65536, minimum time resolution accuracy: 4ps
- Acquisition delay adjustable for each channel: ±100 ns
- Lifetime jitter error: <12ps
- Maximum count rate: 10MHz; Maximum synchronization rate: 84 MHz
- Multiple detector options, detector channels: 2
- Two-dimensional life imaging, XY scanning piezoelectric displacement stage
- Large-range scanning table, with a range of up to a few centimeters,
- XY scan accuracy is better than 500 nm
- Intrinsic delay time: < 95 ns
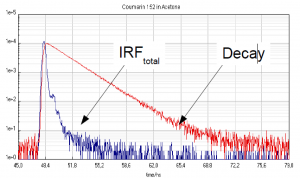
- Instrument Response Function (IRF) < 200ps

 |
 |
FLIM test accuracy (sample Erythrosin B reference value: 89+/-3ps, measured value: 89+/-4ps)
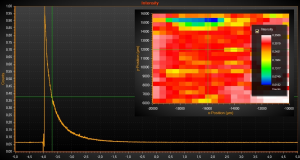
Normal position of the sample (life imaging case) |
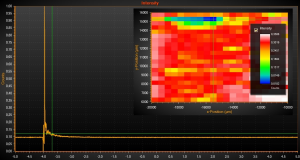
Sample defect location (fluorescence life imaging) |
Main applications:
Fluorescence life test of materials under high pressure, semiconductor wafer testing and analysis research
Cell Biology and Fluorescence Lifetime Imaging (FLIM), Fluorescence-Dependent Spectroscopy (FRED)
III Brillouin Spectrometer
Brillouin spectroscopy is widely used in remote sensing, materials science and biomedicine as a non-contact test for the acoustic, thermodynamic and viscoelastic characterization of materials. Brillouin spectroscopy detects inelastic scattered light with fluctuations in thermal density in acoustic modalities in solids and in liquid gases, derived from the inelastic interaction of incident light and acoustic phonons in materials. The spectral shift of this inelastic scattered light is generally in the subGHz range. Therefore, brillouin spectroscopy is a very weak signal, elastic scattering light (Rayleigh scattering or Michaelis scattering), stray light or sample reflected light can easily mask brillouin spectral signal, requiring spectrometers with very high spectral resolution, but also need high spectral contrast and high extinction ratio.
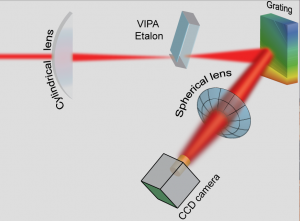
VIPASchematic diagram of the structure of the principle spectrometer
| index | parameter | Reference |
| Wavelength range | 530.5-533.5nm | 783.5~787.5nm
Optional |
| Spectral resolution | <1 pm | <0.6 pm upon request |
| Spectral accuracy | <10 MHz | sample time dependent |
| Pumped laser
Suppression ratio |
> 30 dB | Pump wavelength filter suppression |
| Pump suppression
Wavelength range |
+/- 1nm | Pump suppression filter tunability |
| Pump light
Suppress bandwidth |
0.5pm | Pump suppression filter width |
| Acquisition speed | up to 40 Hz | Brillouin Mapping |
Brillouin spectrometer performance parameters
DAC(Brillouin Spectroscopy in a Diamond Anvil Cell)
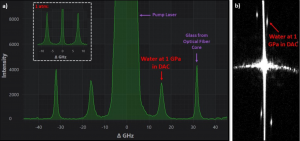
Brillouin spectrum of water in DAC |

Methanol sample Brillouin spectrum |
10ms acquisition time, SNR greater than 30

Fast Brillouin scattering Mapping imaging (ultrafast sampling frequency up to 40Hz)

Ultra-high pumped optical signal rejection ratio (> = 90dB)
IV Customize systems and extend functionality
Microscope: Upright/inverted/dual microscope
Open free space for large sample testing
Long working distance objective lens for high-pressure scientific research
Wide range of UV, visible and nirch objectives
e.g. 20X NA 0.25, LWD 31.00 mm
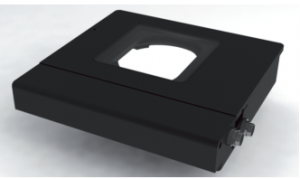
Electric XYZ displacement table with a resolution of <50nm |

Nano piezoelectric displacement table The stroke is 100umx100um Resolution 0.2 nm, matched to motorized microshifters |
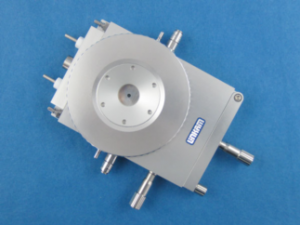
Integrated Linkam hot and cold microscopy sample stage Standard temperature range: -196°C to 600°C Heated sample stages up to 1500°C |
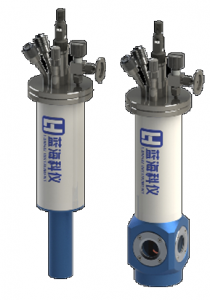
Liquid helium temperature cryogenic thermostat, 5K ~ 300K |

In conjunction with atomic microscopy (AFM). |

Aberration correction spectrometer configuration Princeton Instruments HRS spectrometers offer excellent image quality with dual inlet, dual outlet, and flexible configuration |
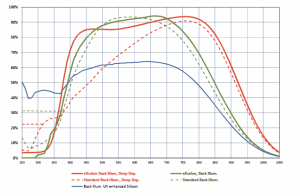
TE refrigeration or liquid nitrogen refrigeration detectors Ultra-low noise for exposure times of up to 1h. InGaAs array detectors |
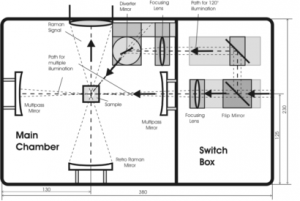
Hongguang Road sample box, Multi-Pass Raman signal enhancement technology for cuvettes, powders, solids, thin films and other samples |
According to the user’s existing spectrometer, detector, laser, microscope, etc., to provide system integration solutions, to achieve high-performance automatic control of spectral test function. Save the user’s budget V. Upgrade to monovista integrated automatic control system according to the user’s existing components
Open System Upgrade Structure Diagram
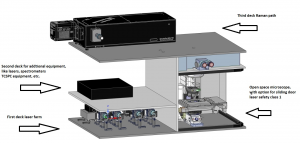
VISTACONTROL software features: cross-platform control software system
- Automatic laser selection, automatic alignment of the optical path
- Wavelength and intensity auto-calibration function
- Temperature control during the heating, cooling phases and cryogenic states
- Automatic Z-axis focusing Raman imaging
- Fast Raman/Fluorescence/Lifetime Mapping
- Various post-processing procedures
- Fluorescence and background suppression
- Spectral library matching data (material composition analysis)
- It is used in conjunction with atomic force microscopy (AFM) and controlled
- Export in various data formats
- Extend the optical path, and use with the external cryogenic table, SEM
Control different test methods to automatically switch to achieve in-situ testing
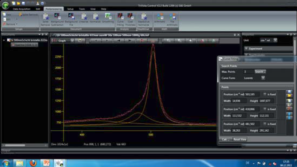
Spectral curve fitting and analysis |
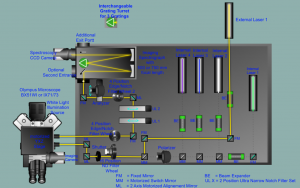
The hardware switches automatically with the laser selector |
|
Fluorescence deduction and background suppression |
3D Raman Images from different Components on one Sample |
Intensity integral Mapping imaging by peak position and peak drift imaging can be done X,Y, Z, XY, XZ, YZ, XYZ mapping, and Z Auto focus mapping.
VI. MonoVista CRS+ Custom system use cases

Monovista CRS+ microscopic Raman combined with macro-optical path Raman, AFM case |

Monovista CRS+ Combination of the system with low temperature and strong magnetic test conditions (Mapping) |
-7.jpg)


