
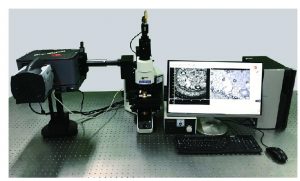
FORTEC The company cooperated with Beijing Institute of Technology to develop
一 Hyperspectral Imaging is the difference between traditional spectrometers
Problems with conventional spectrometers:
- The aberration is too large (typical sample: liquid in a reactor cup, capillaries, or high-focal point illumination, such as a laser).
- Only one spectrum can be displayed at a time, usually using a PMT as a detector.

Micro hyperspectral:
- Measure up to 240 spatially resolved spectra simultaneously.
- Each spectrum is associated with a specific point in the field of view.
- Each spectrum can display up to 640 wavelength data points (WDP).
- The wavelength detector is usually a scientific grade CCD.
- Each row of pixels on a CCD chip contains a spectrum.
 |
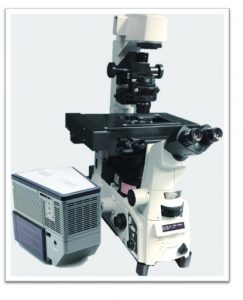 |
Faint darkfield/fluorescence hyperspectral
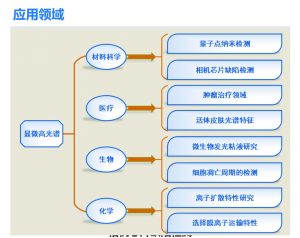
二 Application areas at a glance
Materials science, medical, biology, chemistry…
materials science
(1) Quantum dot nano detection
In a darkfield environment, hyperspectral imaging of plasma gold and silver nanoparticles of different compositions and diameters can be performed. The image on the right shows a darkfield hyperspectral image of gold, silver and other quantum dots taken by a microscopic imaging spectrometer.

(2) Camera chip defect detection
When the surface of the device (chip, micro-light-emitting device) appears defective, its luminous characteristics, light absorption, reflection spectral characteristics will also be different. Hyperspectral imaging of the surface of the camera’s chip is performed to evaluate its surface coating and chip defects.

- Medical field
(1) The role of albumin coupled gold nanoparticles in tumor treatment
Albumin (BSA) bound to gold nanoparticles (GNPs) is utilized as an active carrier targeting liver cells. GNPs-bound albumin is inoculated intra-arterial onto pre-prepared specimens. Intrahepatic tumors of BSA-GNPs (albumin coupled gold nanoparticles) were detected using a microscopic imaging spectrometer and a camera connected to a dark-field microscope. We were able to detect the localization of lysosomals and GNPs in malignant cells. Selective photothermal ablation of malignant tissues of the liver is then carried out.

Schematic diagram of in vitro experimental system for nano-PT ablation of liver cancer |
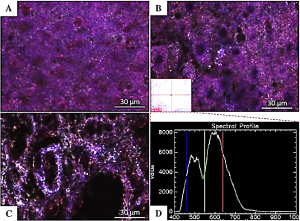
A. Liver health tissue around the tumor B. Area around tumor tissue C. Central area of tumor tissue D. Hyperspectral analysis of intra-punctate structures of malignant tumors Confirmed to be gold nanoparticles |
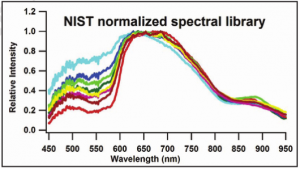
(2) In vivo hyperspectral radiation imaging to identify vascular and non-vascular skin spectral features
Spectral differences between vascular and non-vascular fields are characterized to determine their potential use in monitoring angiogenesis. In the wavelength range of 450-920 nm, the spectrum is classified. The classified spectra are integrated into the spectral library, and subsequent acquisitions are correlated with the library set with a minimum correlation coefficient (MCC) of 99%. The results showed that light colors tended to be areas without a vascular system in the visual field, while those with a reddish color indicated the presence of blood vessels. This work is instructive for monitoring various physiological or pathological processes, including tumor angiogenesis and the therapeutic effects of antivascular drugs.
- Biological field
(1) Chemical analysis of glowing mucus secreted by marine worms Trichophylla
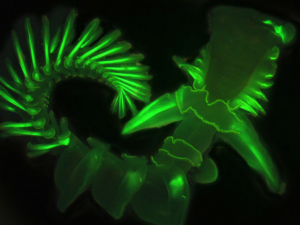
In the darkroom, stimulate the worm bioluminescence by repeatedly adding chemical reagents until the eyes that adapt to the darkness can no longer see the bioluminescence. The sample is then bioluminescent and fluorescence measurements to analyze the fluorescence spectral distribution of the main part of the worm. Hyperspectral analysis is performed using a micro hyperspectral imaging system. From the spectral peaks, it can be concluded that the bioluminescence of marine worms may be produced by photoproteins.
(2) Multiple gold nanorod probes identify cell surface markers

Gold nanorod molecular probes (GNrMPs) were designed and prepared for multiplexing identification of HBEC cell surface markers. Probe cells directly using darkfield microscopy in combination with a spectral imager to simultaneously detect up to three surface markers. The immunophenotypic composition of these cell lines shows their metastatic potential, which is assessed with GNrMPs. This technology has the potential to become an important tool in the diagnosis of breast cancer and other cancers. Using a microscope, cells are imaged in a dark field, scattered GNrMPs appear as bright particles against a dark background, and the right panel depicts darkfield images and plasma spectra of cells with different immunophenotes depicted by GNrMP with different aspect ratios
- Field of chemistry
(1) Research on silver ion carrier gold nanoparticle conjugates

To determine the diffusion characteristics of IP-AuNP in the ion-selective membrane phase, the ion-loaded and ion-free (blank) membrane segments are combined in a glass container. Combining the two membranes induces IP-AuNP to diffuse from the membrane (donor) of the supporting iontocart into the blank membrane (acceptor). The fused membrane is then immediately placed in the field of view equipped with a micro hyperspectral imaging system. Hyperspectral imaging systems have the ability to collect hundreds of full spectra in the visible range along selected observation lines corresponding to the slits of the spectrometer inlet, as shown in the figure. The results show that the spectral lines of the loading film and the blank film are significantly different, and the high spatial resolution of the micro hyperspectral system can be used to sensitively monitor the real-time status of the sample.
(2) Multispectral imaging of neutral carrier cation selection membrane ion transport

High-resolution spectral imaging of cross-sections of ion-selective membranes is performed during real-time electrochemical measurements. Experimental conditions for mass transfer control ion selective electrode (ISE) membranes can be optimized to improve detection limits, as shown in Figure: A: Recording absorbance curves at different time points at 535 and 660 nm, respectively, the maximum absorbance of the unprotonized and protonated chromogenic carrier ETH 5294, respectively. B: Three-dimensional full-spectrum representation of the cross-section of the film. C: False color-coded 3D representation of the cross-section of the film. Left column: Image recorded before polarization. Right column: Image recorded after 4500s polarization.
other
An analytical laboratory mounted on a microscope!
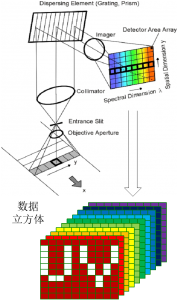
Chiaroscuro field, transflection, fluorescence full-band solution Scanning speed is fast, 10s can collect 1.4GB of data Short optical path, high light transmission, less energy loss Master the core technology, self-developed software No need for an electrically controlled displacement station, can be imaged Customized service, upgraded according to your existing configuration Pre-sale: Free sample testing service After-sales: hardware warranty 1 year, software lifetime free upgrade
三 Three modes of operation
The perfect customized solution to meet all your needs!
- Optical Imaging Mode: Equivalent to a conventional optical camera, it is possible to perform conventional optical imaging of samples
- Spectral Mode: Displays its spectral data at a location.
- Imaging Spectral Mode: Obtains spectral data for all cell points on a spatial target.
四 Technical data at a glance

五 Demonstration of the experimental process
Full-featured self-developed software, compatible with any mainstream hardware device!
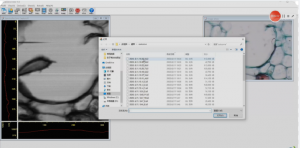
六 Software

- We have our own developed operating software
- Supports mainstream science-grade cameras
- It has perfect spectral data analysis and other functions
peculiarity:
- Minus background collection settings
- Image stitching settings
- Image color display settings
- Convenient data storage
- Image and spectral analysis is convenient
function
- Support multi-band display
Data loading by spectral segments when reading data, with image display functions for different segments.
- Supports the switching display of images and curves
Select a different location on a grayscale image of a certain spectral segment to complete the spectral curve display at that position;
Select the location of the segment on the spectral curve to complete the loading of the grayscale image at that segment.
- Supports data stitching
Supports spectral stitching and image stitching.
Data for any segment of the target can be obtained by spectral splicing.
Spectral data acquisition of any target size of the target can be achieved through image stitching.
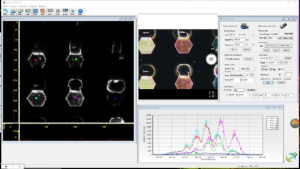
多谱段显示 |
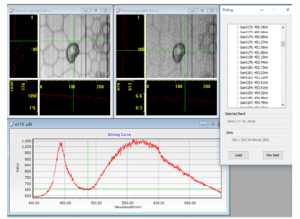
图像与曲线的相互切换 |

光谱拼接 |
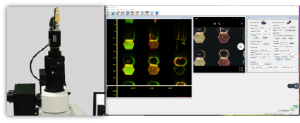
- The software supports microscopic observation display, viewing the camera window
- Compatible with mainstream science-level CCD/Cmos,
- It is convenient for operators to assist in observing and recording images in real time.
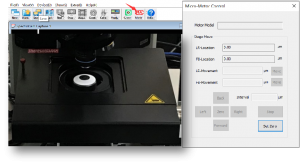
- Electronically controlled displacement station control
The software supports the integrated control of mainstream electronic consoles.
 |
 |
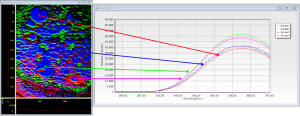
- Different colors represent different substances, and the spectral principal components are identified
Its corresponding spectral curves are completely inconsistent。
 |
 |


